CPU-initiated I/O: IOMMU Translation Overhead#
AiSIO drives NVMe devices from user space. A device moves data into memory by DMA, and a user space driver can handle that DMA in one of two ways.
Driver |
IOMMU |
Memory the device can write |
|---|---|---|
|
off |
all of physical memory |
|
on |
only the buffers the program allowed |
With vfio-pci, the IOMMU translates every address the device sends into a
physical address and checks that it falls in an allowed buffer, so a bad address
cannot overwrite the kernel or another program. A production deployment needs
this protection, but it may cost performance, since every transfer adds an
address translation step.
This experiment measures the performance cost of enabling the IOMMU. It runs the same I/O both ways, once with the data buffers in host memory and once in GPU memory, where the device writes straight into GPU memory over peer-to-peer DMA. Before throughput saturated, enabling the IOMMU reduced throughput by at most 0.6%. A second part looks at how GPU memory is mapped in the IOMMU, which accounts for the result.
Independent Variables#
Variable |
Parameter Set |
|---|---|
IOMMU |
off ( |
Buffer location |
host hugepages (upcie), GPU memory (upcie-cuda) |
Workload |
4 KiB random read, 128 KiB sequential read |
Queue depth per device |
{ 1, 2, 4, 8, 16, 32 } |
Number of devices |
16 |
Tool |
xnvmeperf ( |
Metrics Collected#
Metric |
Reported by |
|---|---|
Completed IOPS / bandwidth |
xnvmeperf, fio |
Mean latency |
fio |
xnvmeperf reports throughput only, so fio was added to measure latency. With both tools measuring throughput, each throughput result is also checked against a second, independent measurement.
xnvmeperf opens all 16 devices in one process and reports one total. fio runs one job per device as threads of one process and reports per device, and the per-device results are summed. Both tools allocate their data buffers through the same xNVMe backend, so both cover host and GPU memory.
Environment#
The benchmarks were run on the NVMe Storage Server.
Hardware |
Details |
|---|---|
CPU |
2x Intel® Xeon® Scalable 3rd Gen (Ice Lake-SP), 24 cores, SMT |
GPU |
1x NVIDIA L4 24GB, PCIe Gen4 x16 |
Storage |
16x Samsung MZTLD15THEPB, PCIe Gen4 x4, on the GPU’s NUMA node |
The 16 NVMe devices and the GPU sit on the same NUMA node, and each device is pinned to its own CPU core on that node. Each configuration runs for 30 seconds and is repeated five times, and results are reported as arithmetic means.
The IOMMU-off and IOMMU-on halves run in separate boots. The IOMMU-off boot uses
intel_iommu=off. The IOMMU-on boot uses intel_iommu=on, and
vfio-pci attaches the devices through iommufd.
Execution of the Experiment#
Instructions for running bench_iommu_overhead_host.yaml and
bench_iommu_overhead_gpu.yaml are provided in
Experimental Framework. Each workflow reboots the system twice to
switch the IOMMU off and on.
Results#
Results are presented as throughput and latency vs. queue depth per device, with the IOMMU off and on. All configurations use 16 NVMe devices, with buffers in host memory through the upcie backend and in GPU memory through the upcie-cuda backend. Throughput is measured with xnvmeperf and fio, and mean latency with fio.
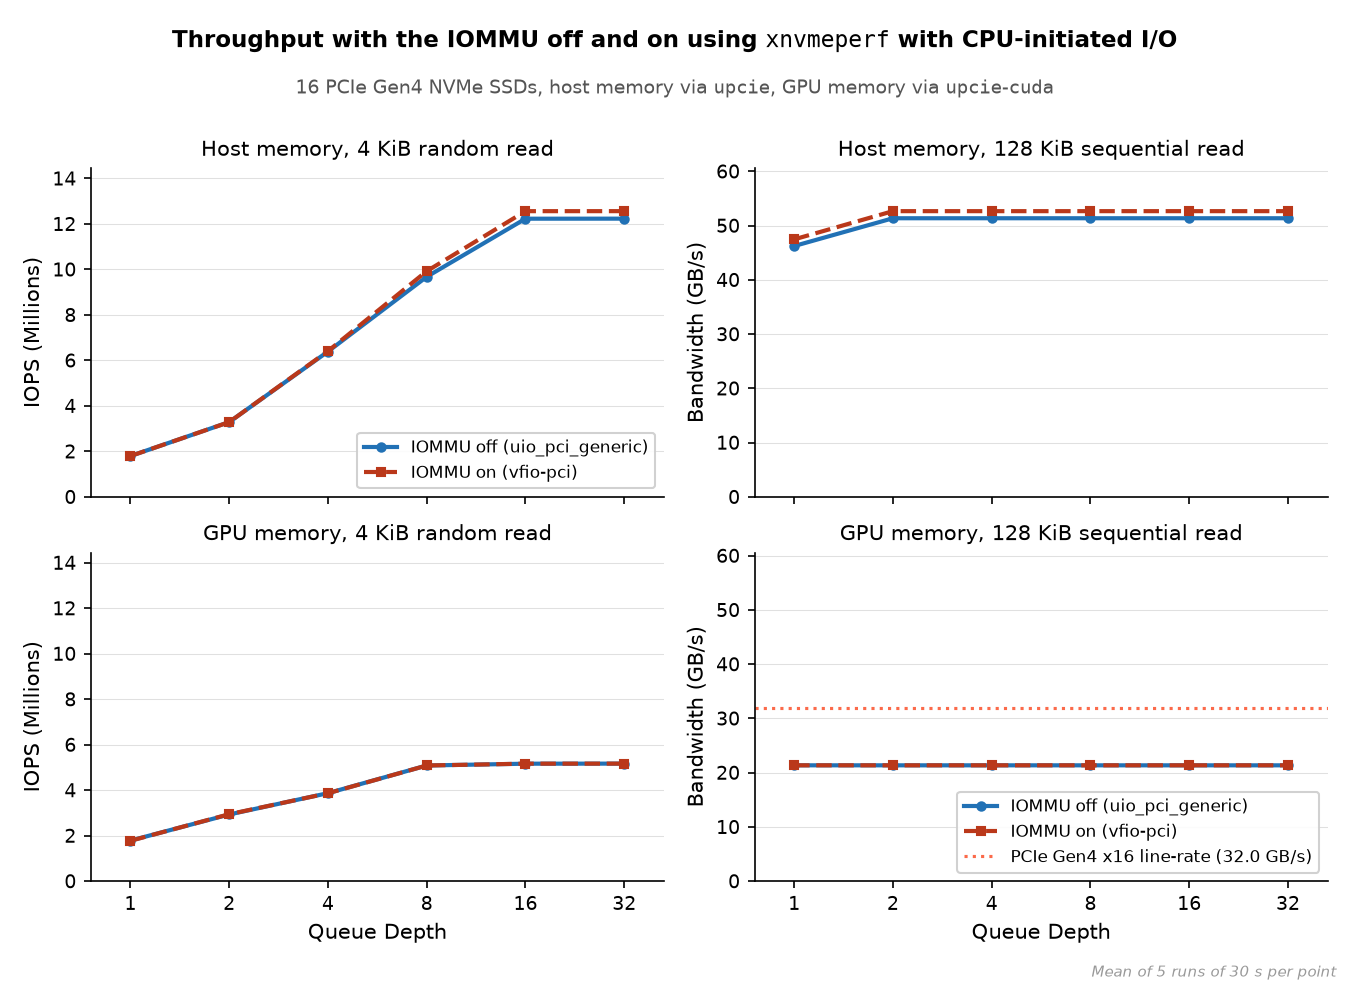
Throughput with the IOMMU off and on, measured with xnvmeperf on 16 NVMe devices. Rows are the buffer location and columns the workload, and each column shares one scale. The dotted line is the line rate of the GPU’s PCIe Gen4 x16 link.#
Throughput Ceilings#
Throughput rises with queue depth until it reaches a bandwidth ceiling, and
then saturates. With host memory, 4 KiB random read saturates at 12.2 M IOPS
(50.1 GB/s) and 128 KiB sequential read at 51.3 GB/s, so both workloads stop at
about the same number of bytes moved. That is 3.2 GB/s per device, well below
the 8.0 GB/s of a Gen4 x4 link, so the host limit lies upstream of the devices.
The 16 devices sit behind two PCIe switches, eight on each, and each switch
connects to the CPU through one Gen4 x16 link. The two uplinks give a line rate
of 64.0 GB/s, and the measured 51.3 GB/s is 80% of it. A PCIe link carries
less data than its line rate, because 128b/130b encoding and packet headers
take part of it. The PCIe bandwidth saturation experiment measured the practical bandwidth of a Gen5
x16 link with nvbandwidth, NVIDIA’s copy bandwidth benchmark, at 53.3 GB/s,
83% of the line rate. The host ceiling is close to that share, so we take the
switch uplinks to be the host limit.
The ceiling is lower for GPU memory, and the GPU falls behind from queue depth 2. At queue depth 1, host and GPU memory give the same throughput (1.79 and 1.78 M IOPS at 4 KiB): with one command in flight per device, where the buffer lives does not matter. From queue depth 2 the GPU reaches 0.89 of the host throughput, then 0.61 at queue depth 4 and 0.42 once both have saturated. The GPU ceiling is 21.3 GB/s, reached at queue depth 8 for 4 KiB and already at queue depth 1 for 128 KiB. It is 67% of the 32.0 GB/s line rate of the GPU’s PCIe Gen4 x16 link. The GPU has its own root port and shares no switch with the devices, so every peer-to-peer transfer crosses the CPU between two root ports. That path, rather than the GPU’s link, may set the ceiling.
IOMMU Overhead Below Saturation#
In the throughput figure the IOMMU-off and IOMMU-on curves overlap, because a difference of a few percent is too small to see at that scale. The change figure plots that difference directly, as the IOMMU-on throughput relative to the IOMMU-off throughput at each point. It includes fio as well as xnvmeperf, and shades the points below the throughput ceiling, the only ones where a translation cost could show. The shading uses a ceiling of 97% of the xnvmeperf peak. At 4 KiB the highest shaded queue depth is at 75% of the GPU’s peak and the next point at 98%, so any ceiling between those two shares selects the same points.
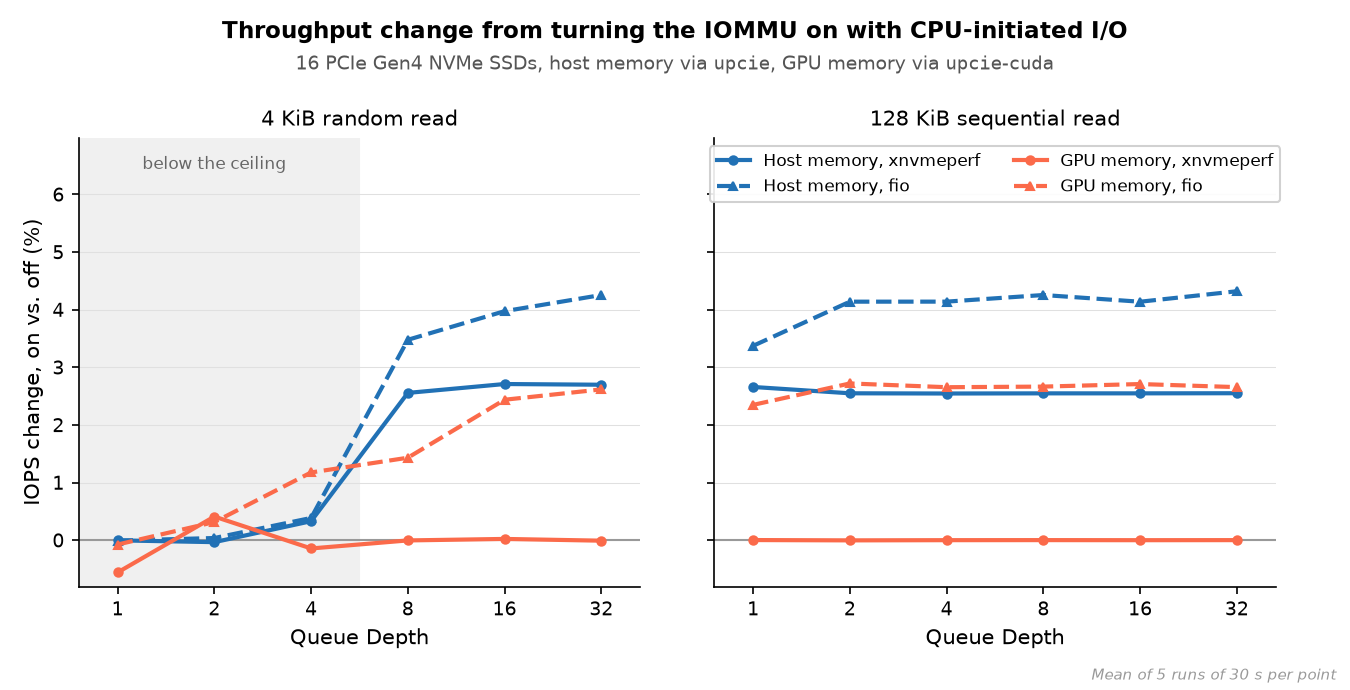
IOPS change from turning the IOMMU on, relative to the IOMMU-off run. Positive values mean the IOMMU-on run was faster. The shaded points are below the xnvmeperf throughput ceiling for both buffer locations.#
Below saturation, turning the IOMMU on made I/O at most 0.6% slower. At the shaded points, 4 KiB random read at queue depth 1 to 4, the change stays within 0.6% in either direction for both buffer locations and both tools. The one exception is fio on GPU memory at queue depth 4, at +1.2%. The repeat standard deviation at these points is 0.01 to 0.2%, so the changes of 0.3% and more, up to that +1.2%, are larger than it, while those of 0.04% or less on host memory at queue depths 1 and 2 are not (see Run Validity). Either way they change sign from one point to the next, so they show no consistent cost of translation.
Buffer |
Tool |
qdepth 1 |
qdepth 2 |
qdepth 4 |
|---|---|---|---|---|
host memory |
xnvmeperf |
-0.00% |
-0.03% |
+0.33% |
host memory |
fio |
-0.01% |
+0.04% |
+0.39% |
GPU memory |
xnvmeperf |
-0.56% |
+0.41% |
-0.14% |
GPU memory |
fio |
-0.07% |
+0.31% |
+1.18% |
IOMMU-on Offset at the Ceiling#
At the ceiling, the IOMMU-on runs measured higher, not lower. With host memory the IOMMU-on run was 2.5 to 2.7% faster with xnvmeperf and 4.0 to 4.3% faster with fio. With GPU memory, fio was 1.4 to 2.7% faster, while xnvmeperf showed no change. Translation itself cannot make a transfer faster, so the offset comes from something else that differs between the two halves: they run in separate boots and under different drivers. Its exact cause was not found. It appears only where throughput is at its ceiling, and it does not change the conclusion that the IOMMU-on runs were never more than 0.6% slower.
Latency#
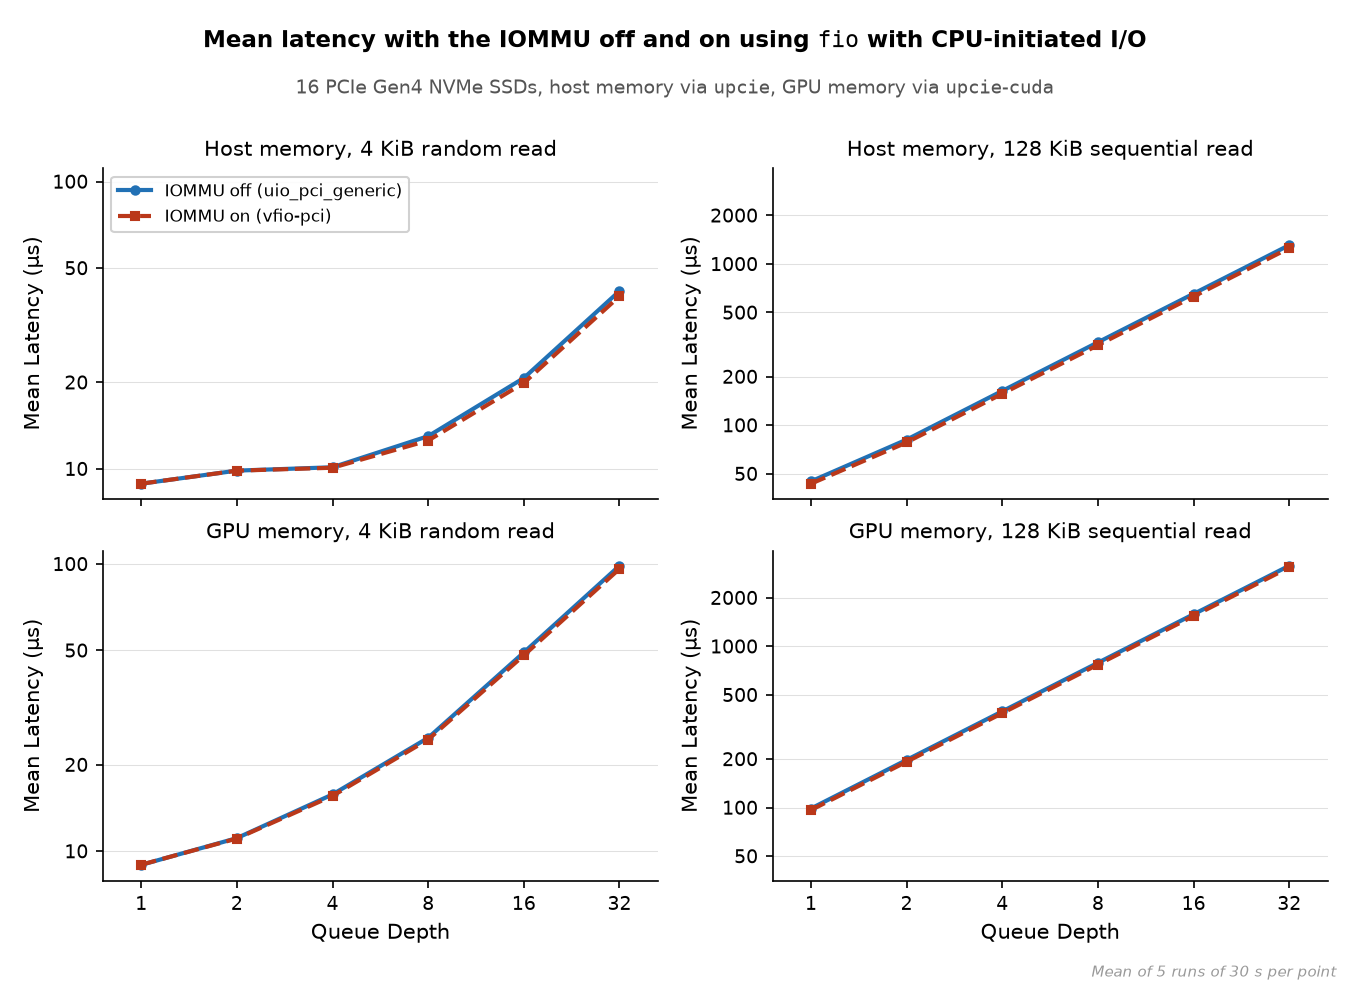
fio’s mean latency with the IOMMU off and on, on a log scale, laid out like the throughput figure.#
On GPU memory, latency rises before throughput reaches the ceiling. Both buffer locations start at 9 µs at queue depth 1. With host memory, latency stays near 10 µs up to queue depth 4, while with GPU memory it has already risen to 11.1 µs at queue depth 2 and 15.8 µs at queue depth 4, with throughput still below the ceiling. This suggests that the GPU link approaches saturation, which would also explain why the GPU falls behind the host from queue depth 2.
Once a run reaches its ceiling, latency doubles with every doubling of queue depth, so additional queue depth only adds queueing delay: on GPU memory, 24.8, 49.2 and 98.6 µs at queue depth 8, 16 and 32. At 128 KiB, a single command per device on GPU memory already takes 98.6 µs, the time to move 16 × 128 KiB at 21.3 GB/s.
Turning the IOMMU on leaves latency unchanged below the ceiling, 8.9 µs on host memory and 9.0 µs on GPU memory at queue depth 1 either way. The latency figure needs no change figure of its own: fio keeps the queue depth fixed, so its latency change is its throughput change with the sign flipped, within 0.3 percentage points at every point, and the fio lines of the change figure already show it.
Run Validity#
The five repeats of each configuration vary little: the standard deviation of the IOPS is at most 0.3% of the mean, and 0.02% at the median.
With the IOMMU off, xnvmeperf and fio measure within 3.6% of each other at every point, and within 0.4% at the ceiling. With the IOMMU on, fio measures 1.3 to 3.1% higher than xnvmeperf at the ceiling, which is the IOMMU-on offset showing up more in fio than in xnvmeperf. Mean latency times IOPS matches the number of commands in flight, 16 devices times the queue depth, within 3% at every point, so throughput and latency are consistent with each other.
IOMMU Mapping Granularity#
Why did turning the IOMMU on cost so little? For GPU memory, the answer lies in how the buffer is mapped: once, before any I/O, with large pages, so that 1 GiB of GPU memory becomes 512 entries of 2 MiB. The mapping structure is measured. That it makes translation cheap is an inference from it.
The IOMMU caches translations in the IOTLB, and adds cost in two places: walking the page table on an IOTLB miss, and creating and removing mappings. uPCIe maps its buffers once when the backend starts, so only misses can cost anything during a run, and how often they happen depends on the page size: covering 1 GiB takes 262,144 entries with 4 KiB pages, 512 with 2 MiB pages, and one with a 1 GiB page.
The kernel maps with the largest page the hardware supports to which both the device address and the physical address are aligned. A GPU buffer therefore gets 2 MiB pages only if it is mapped in calls of at least 2 MiB, as upcie-cuda does, and its physical address is 2 MiB-aligned.
To see the page size the kernel actually used, a test program exported a 1 GiB
GPU buffer as a dma-buf and imported it through uPCIe on behalf of an NVMe
device, which makes the kernel map the buffer into that device’s IOMMU domain.
The mapping was traced with the iommu:map tracepoint and with kprobes on the
Intel IOMMU driver.
Observation |
Result |
|---|---|
|
one 1 GiB call, physical address 0x480f600000 |
Pages the driver wrote (kprobe) |
512 pages of 2 MiB, no 1 GiB page |
BaM’s mapping path ( |
1 GiB and 4 GiB, both as 2 MiB pages |
Paths that map in 64 KiB calls, such as GDS |
4 KiB pages only |
The buffer started at 0x480f600000, 246 MiB into the GPU’s BAR1 window, which is aligned to 2 MiB but not to 1 GiB. That alignment, not the unit upcie-cuda maps in, caps the page at 2 MiB. A 1 GiB GPU window is thus covered by 512 page-table entries, installed before any I/O, with nothing mapped or unmapped during the run. This is consistent with the small differences below saturation. IOTLB misses themselves were not counted, because the IOMMU of the machine used reports no performance counters.
The mapping was measured on the development PC, an
Intel platform with an NVIDIA RTX PRO 4000 Blackwell, not on the storage
server. upcie-cuda goes through the same iommu_map() and the same rules
as the test program. Host buffers are hugepages, also mapped once when the
backend starts, but their mapping was not traced.
Summary#
Below saturation, turning the IOMMU on made I/O at most 0.6% slower: at 4 KiB random read and queue depth 1 to 4, throughput changed by -0.6 to +1.2% with host memory and with GPU memory, with no consistent sign. Both buffer locations then reach a bandwidth ceiling, about 51 GB/s for host memory and 21.3 GB/s for GPU memory, where the IOMMU-on runs measured up to 4.3% higher, for a reason that was not found. The small effect is consistent with how GPU memory is mapped: 1 GiB becomes 512 page-table entries of 2 MiB, installed once before any I/O. Because the GPU sits at its ceiling over most of the sweep, a follow-up with more GPUs on a PCIe Gen5 platform will extend the range in which a translation cost could show.