CPU-initiated I/O: Optimal Parameter Search#
The AiSIO evaluation spans CPU-initiated, P2P, and device-initiated I/O paths. Before comparing them, it is necessary to establish what optimal CPU-initiated performance looks like and which system parameters govern it. This experiment characterizes the performance of CPU-initiated I/O across a wide parameter space, identifying the configuration that maximizes IOPS. The resulting parameterization serves as the reference point for subsequent experiments, and the scalability results provide context for interpreting the other I/O paths studied in this work.
I/O is CPU-driven with host memory used for submission and completion queues and for command payloads. All measurements are driven by SPDK’s benchmarking tool, bdevperf, and results are reported as the average of five runs per configuration to reduce variance.
Independent variables#
For the experiment, five environmental conditions were defined as independent variables:
Fixed CPU frequency or CPU governor
Turbo boost enabled vs. disabled
SMT enabled vs. disabled
Thread siblings used vs. not used
Unused CPUs stressed vs. idle
Furthermore, a single run of bdevperf is run with the following arguments:
Queue depth
I/O size
Configuration file
CPU mask
Time in seconds
Read-write type
Each run lasted 10 seconds, and the read-write type used was “randread” for all runs. The configuration file and CPU mask describe how many and which block devices and CPUs to use, respectively. The independent variables defined from these arguments were queue depth, I/O size, number of devices and number of physical cores.
The construction of the bdevperf configuration file with the right amount of block devices was automated, given the total list of devices on the system and the desired amount for this specific run.
To construct the CPU mask, logical CPUs were added depending on their ID in increasing order until the desired amount of cores was reached. NUMA nodes were not considered, as experiments showed it did not have a significant impact on the results. When using thread siblings, the amount of logical CPUs used are doubled, as there are two threads on each of the cores.
The complete list of independent variables and the values for the variables are:
Variable |
Parameter Set |
|---|---|
CPU frequency / governor |
{ powersave, performance } |
Turbo boost |
{ on, off } |
SMT |
{ on, off } |
Thread siblings |
{ used, not used } |
Stress |
{ on, off } |
Queue depth |
{ 64, 128, 256 } |
I/O size |
{ 512, 4096 } |
Number of cores |
{ 1, 2, 4, 8 } |
Number of devices |
{ 1, 2, 4, 8, 16 } |
The Cartesian product of the variable sets, excluding the illegal combination of SMT off with thread siblings used, defines the full set of benchmark runs.
After identifying the parameterization which yielded the highest IOPS, we individually expanded the set of values for each variable to explore the results beyond the initial selection. The expanded parameter set is listed below. Note that not all combinations in the expanded parameter set were tested.
Variable |
Expanded Parameter Set |
|---|---|
CPU frequency / governor |
{ powersave, performance } |
Queue depth |
{ 8, 16, 32, 64, 128, 256, 512, 1024 } |
I/O size |
{ 512, 1024, 2048, 4096, 8192 } |
Number of cores |
{ 1, 2, …, 16 } |
Number of devices |
{ 1, 2, …, 16 } |
Metrics Collected#
The collected metrics are:
Metric |
Reported by |
|---|---|
Completed IOPS |
bdevperf |
Bandwidth (MiB/s) |
bdevperf |
CPU utilization (%) |
|
Measured CPU frequencies (kHz) |
|
All numbers are reported as arithmetic means over the 10-second measurement interval.
As bdevperf uses busy polling, it will always result in approx. N*100% CPU utilization, where N is the number of used logical CPUs.
The CPU frequencies of each logical CPU is collected by a minimal shell script
that reads from /sys/devices/system/cpu/cpuX/cpufreq/scaling_cur_freq every
0.5 seconds for each used CPU with ID X. The read frequencies, reported in
kHz, are appended to a log and later averaged. This script is started before
running the benchmarks and stopped immediately after. To account for the time
before and after the benchmarks where the script is running, but bdevperf is
not, the first and last 10% of the reported cpu frequencies are discarded.
Environment#
The benchmarks were run on the High-Performance Compute Server. All block devices were empty and bound to the uio-pci-generic user space driver. The CPU used the intel_cpufreq driver.
Empty vs. Populated Block Devices#
In this work, the goal is to measure the maximum IOPS the CPU and I/O stack are capable of driving. For this reason, benchmarks are executed against empty block devices. Using empty devices minimizes variability introduced by data layout, garbage collection, and background maintenance operations, allowing results to more directly reflect CPU scheduling, interrupt handling, and I/O submission and completion paths.
While this methodology may produce IOPS figures that exceed those seen in real- world, data-bearing workloads, it provides a clearer upper bound on CPU-driven I/O capability. These results should therefore be interpreted as a measure of system overhead and scalability rather than as an indicator of application-level storage performance.
Because of this, the theoretical device capacity for random reads of 3.2 million IOPS of the Samsung PM1753 is not applicable in these experiments. To determine a relevant cap, we use the maximum IOPS reached from any experiment using only one device. The determined capacity was only used in the analysis of the results to evaluate whether the benchmark was capped by the device, CPU, or the parameterization.
Stressing Unused CPUs#
The independent variable “Unused CPUs stressed vs. idle” describes whether the tool stress-ng is used to put a workload on the logical CPUs, not covered by the CPU mask given to bdevperf.
The purpose of testing with and without stressing the unused CPUs is to evaluate how other processes in the system impact the achievable IOPS.
Execution of the Experiment#
Instructions for running bench_io.yaml are provided in
Experimental Framework.
Results#
Determining Device IOPS Capacity#
To establish a device-side upper bound, we define device capacity as the maximum IOPS observed in any single-device experiment. In our environment, we were able to reach 3 857 938 IOPS with only one device, and as such, this was used as the device capacity for our analysis.
Optimal Parameterization#
With all 16 devices utilized, we were able to reach this capacity of almost 62 million IOPS using 8 physical cores. The parameterization to achieve this was:
Independent Variable |
Value |
|---|---|
CPU frequency / governor |
performance |
Turbo boost |
on |
SMT |
on |
Thread siblings |
{ used, not used } |
Stress |
{ on, off } |
Queue depth |
128 |
I/O size |
512 |
Number of cores |
8 |
Number of devices |
16 |
When using thread siblings, it did not matter whether the unused CPUs were stressed or idle. When not using thread siblings, stressing the unused CPUs caused the IOPS to drop due to the resources of the physical cores being divided between the bdevperf and stress-ng processes. The results for the parameterization above were:
Id |
Thread siblings |
Stress |
Reached IOPS |
|---|---|---|---|
A |
used |
off |
61 720 159 |
B |
used |
on |
61 622 306 |
C |
not used |
off |
61 712 325 |
D |
not used |
on |
41 065 835 |
Each parameterization has been given an id to allow for easy reference in the following sections. Altering the values of the independent variables from the best-performing parameter set, results in poorer performance. In the following, we will describe how altering each variable independently affects the results. As the parameterizations A, B and C elicit the best results, these will be at focus in the following sections.
We saw that all three parameterizations respond similarly to changes in the remaining independent variables. Because of this, we have only included the results of parameterization C in our graphs for readability’s sake. The presented results for all graphs, are averages of running the experiments five times. Note that variances are plotted as shaded areas around each line, but in most cases are too small to be visible.
Effect of the Independent Variables#
In this section, we will inspect the effect on the results of changing the independent variables.
CPU Frequency and Governors#
We saw a significant decrease in reached IOPS when switching the CPU governor to “powersave”. On average, the results decreased by 64.19 % for parameterization A-C.
Parameterization Id |
IOPS |
Change |
|---|---|---|
A |
23 972 222 |
61.2 % decrease |
B |
23 879 418 |
61.3 % decrease |
C |
18 422 224 |
70.2 % decrease |
When inspecting the CPU frequencies, we generally see that the performance CPU governor keep the clock speed at 3.3 GHz for all CPUs, which is the maximum clock speed we were able to reach with turbo boost enabled. The powersave governor reduces the clock speed in order to reduce the power consumption, which explains the significant IOPS reduction observed.
Turbo Boost#
When turning turbo boost off and thereby limiting the clock speed to 2.6 GHz, we get small decrease, on average 4.4 % less IOPS.
Parameterization Id |
IOPS |
Change |
|---|---|---|
A |
59 731 756 |
3.2 % decrease |
B |
59 570 168 |
3.3 % decrease |
C |
57 606 912 |
6.7 % decrease |
However, we were able to reach similar results without turbo boost enabled by doubling the amount of CPU cores, as we will go into detail with in a later section.
SMT#
When SMT is turned off, thread siblings are not available, and our results are limited to parameterization C. Here, we saw a similar decrease as when turbo boost was disabled. The measured CPU frequencies here do not exceed 2.6 GHz, indicating that the performance CPU governor does not trigger turbo boost when SMT is disabled, explaining the similar performance decrease.
Parameterization Id |
IOPS |
Change |
|---|---|---|
C |
57 965 380 |
6.1 % decrease |
D |
57 729 981 |
40.6 % increase |
Using a fixed CPU frequency with the userspace CPU governor of 3.0 GHz results in higher IOPS when SMT is disabled, than the performance CPU governor.
Parameterization Id |
IOPS |
Change |
|---|---|---|
C |
61 664 783 |
0.1 % decrease |
D |
61 565 869 |
49.9 % increase |
Interestingly, we observe little difference between parameterization C and D when SMT is disabled. This supports the explanation for why parameterization D performs worse than A, B, and C with SMT disabled, each physical core can execute only a single thread, eliminating contention but also preventing bdevperf from benefiting from simultaneous multithreading.
Queue depth#
We found that the results peaked when using a queue depth of 128. With turbo boost enabled, we reached the device cap with both queue depths 128, 256 and 512, but disabling turbo boost highlights the peak at 128.
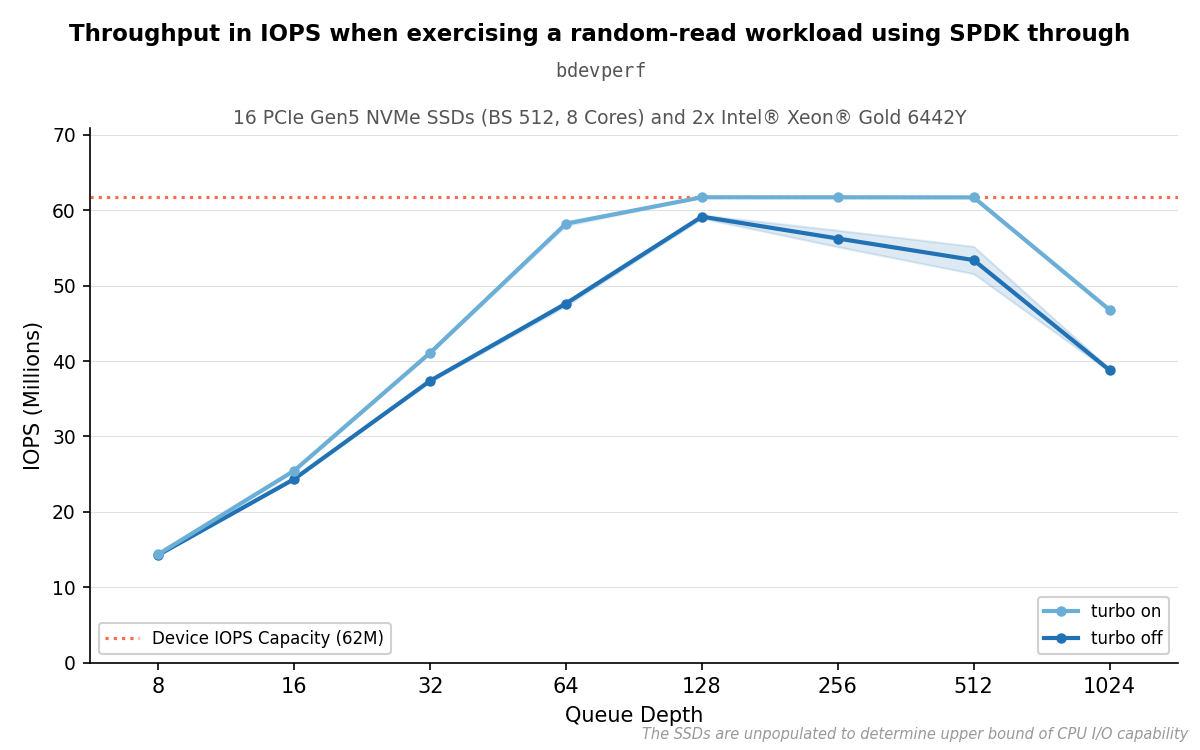
Results of parameterization C with different queue depths.#
I/O size#
Increasing the I/O size to 4096 results in each operation taking more time, so the reached IOPS decreases as seen in the graph. However, the bandwidth tells a different story: it scales roughly proportionally with I/O size, doubling from approximately 30 GiB/s at 512 bytes to approximately 215 GiB/s at 4096 bytes, where it plateaus. This plateau coincides with the point at which IOPS drops sharply, suggesting a bandwidth ceiling is reached rather than a CPU-side bottleneck. Performance does not necessarily suffer from higher I/O sizes; the trade-off is fewer, larger operations rather than degraded throughput.
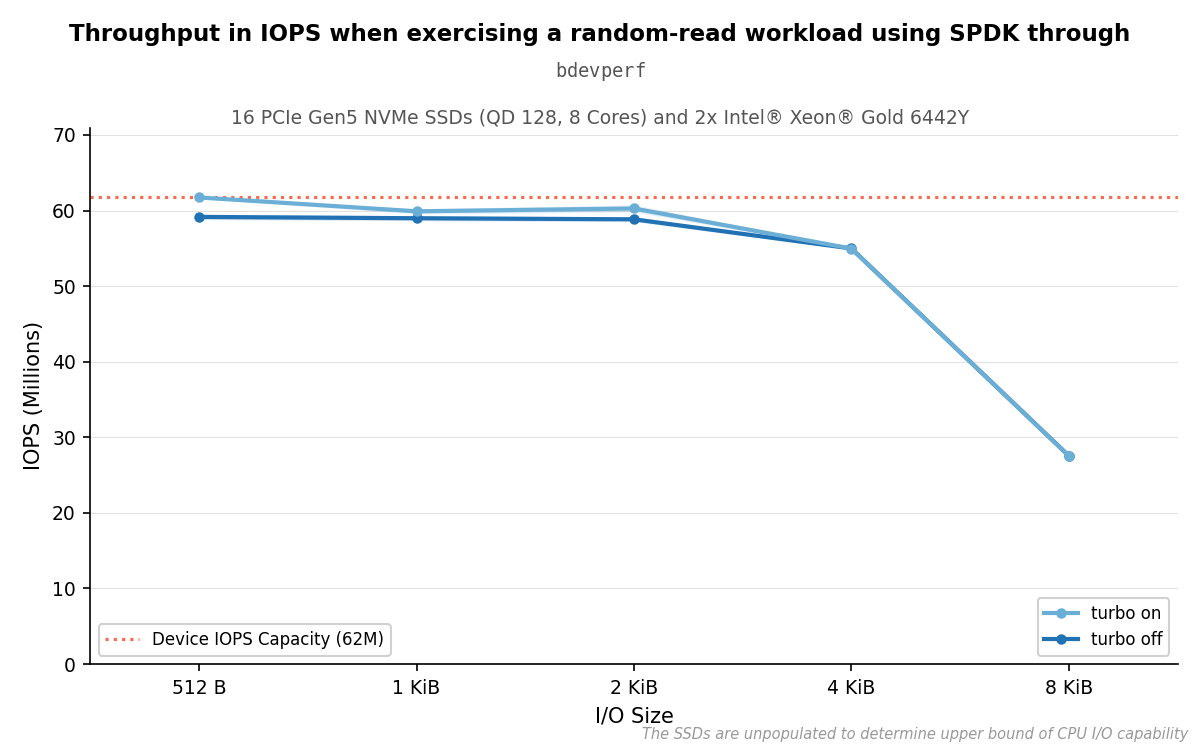
Results of parameterization C with different I/O sizes.#
Number of Cores#
For the selected parameters, the results scale linearly with the amount of physical CPU cores used until we reach a core-to-device ratio of 1:2. At this point, we generally reach the device capacity when turbo boost is enabled. However, disabling turbo boost results in an approximately 4.4 % decrease in IOPS, and increasing the amount of CPUs gives diminishing returns, as seen in the graph below. We are able to reach a similar result as with turbo boost enabled once the core-to-device ratio is 1:1, meaning there is one core per device.
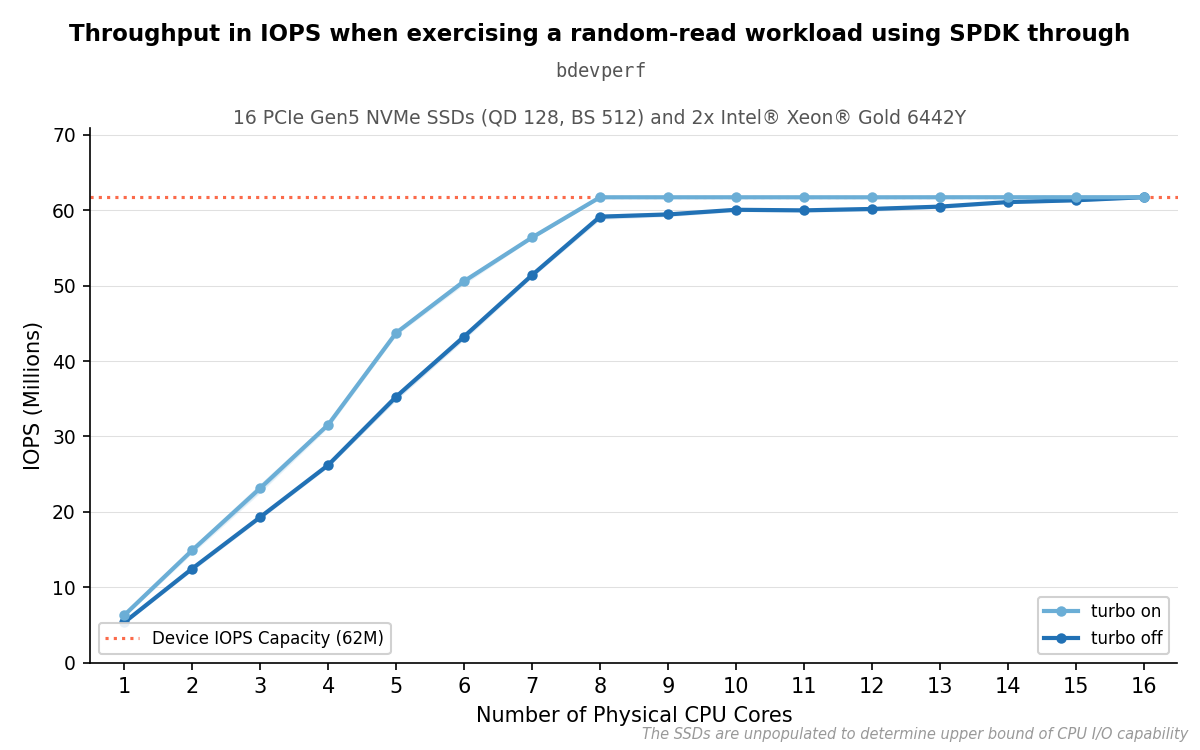
Results of parameterization C with and without turbo boost enabled.#
Number of Devices#
The results scale linearly with the amount of devices used.
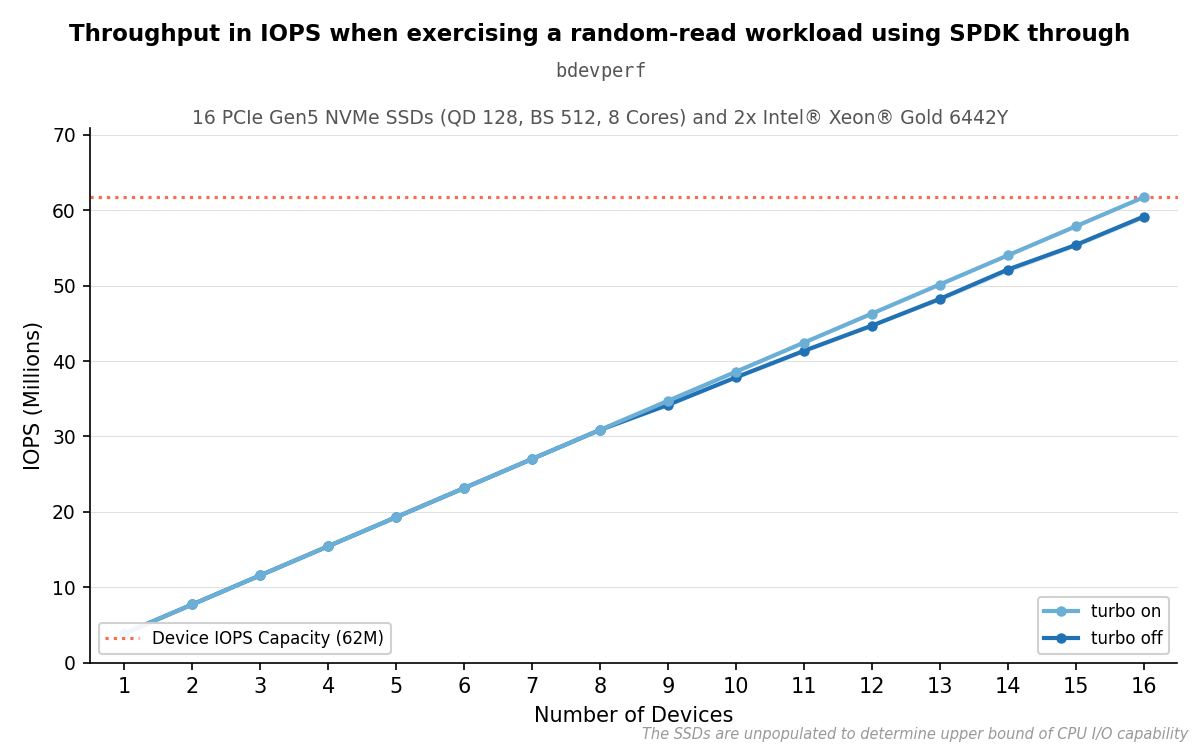
Results of parameterization C with different devices.#
Summary#
The optimal configuration — “performance” governor, turbo boost enabled, SMT enabled, queue depth 128, 512-byte I/O — achieves approximately 61.7 million IOPS across 16 devices using 8 physical cores. Performance scales linearly with both device count and core count up to the device capacity ceiling, and the per-device capacity observed in single-device runs (3.86 million IOPS) serves as the roofline used in subsequent experiments. This parameterization is held fixed in the benchmark tool and NVMe driver comparison that follows, isolating the effect of tool and driver choice from the parameter space explored here.